

This site complements the article published in the Medical Journal of Australia which describes the development of a national depression index for Australia. (A National Depression Index for Australia by Andrew Mackinnon, Anthony F Jorm and Ian B Hickie, Medical Journal of Australia, 181(7), S52-S56, 4th October, 2004). The primary purpose of this site is to provide to details of how to obtain and administer the questions required and to provide the resources necessary to calculate index scores from such data.
About the National Depression Index (NDI)
The NDI has been developed to track changes in the population and groups over time and to enable groups within the population to be compared and groups who may be at elevated risk of depression to be identified.
Unlike other serious illness, there is no register of cases of depression or any other mental health disorder. Many people with the condition do not seek help. Also, many people who have symptoms of depression but whose symptoms fall below the cutoff level for a formal diagnosis may be significantly disabled by their problems. These factors mean that the only reliable statistics on the mental health of the entire population must come from surveys. However few surveys have the resources to collect the information required to make formal, clinical diagnoses of mental health disorders. The NDI attempts to bridge this gap. It is based on only six short questions but is calibrated against diagnoses of clinical depression in a large sample representative of the Australian population. Using another, independent sample of the population, it has been scaled so that the value of 100 is the benchmark value for Australia (as at 2001).
How the NDI was developed
Confirmatory factor analysis was used to identify items from the Australian version of the Kessler 'K-10' scale most strongly related to depression. This scale had been administered in the large (N>10,000) National Survey of Health and Wellbeing. This survey included also an interview that yielded diagnoses of depression according to DSM-IV criteria so the chosen items could be 'calibrated' against clinical diagnoses. Factor scores were calculated for each respondent, locating them on a depression 'dimension.' A problem with these scores is that they have no intuitive meaning - it would difficult to look at the mean factor score of a group and say whether it represented high or low levels of depression. To overcome this limitation, a transformation was developed that yielded values that can be readily interpreted. Using a logistic regression model relating factor scores to the diagnosis of depression, estimated probability of being a 'case' of depression was estimated. These values were calculated for respondents from another large sample representative of the Australian population - the ABS National Health Survey (2001). Individual probabilities were then divided by the average for this sample (0.048) and multiplied by 100. This means that individual values can be interpreted as risk of depression relative to the Australian population. Values of 100 are 'average' risk, values greater than 100 represent higher risk of depression. The value of the index for a group is simply the average of the individual values.
Although the steps may seem convoluted and complicated, they make maximum use of a very small amount of information and produce an index that, we hope, everyone will be able have an intuitive feel for.
What the NDI is for
The NDI has been developed to track changes in the population and groups over time and to enable groups within the population to be compared and groups who may be at elevated risk of depression to be identified. Below are two examples of its use.
|
|
|
|
NDI values for income groups |
NDI values employment status |
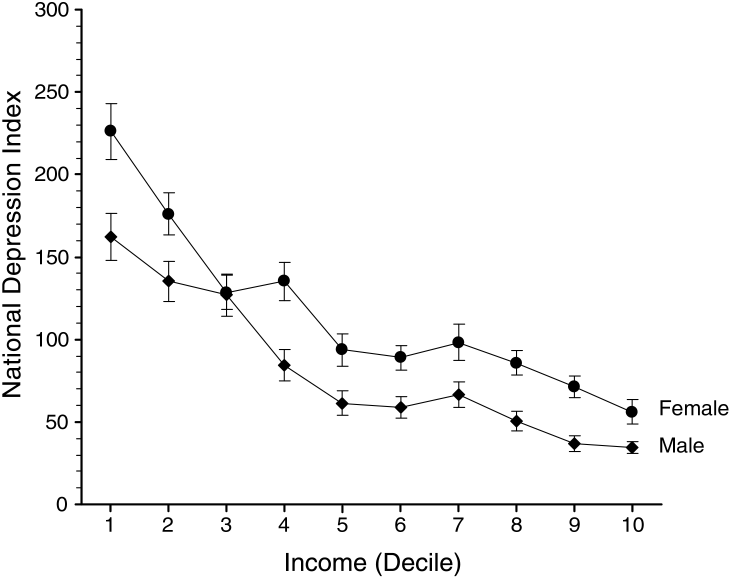
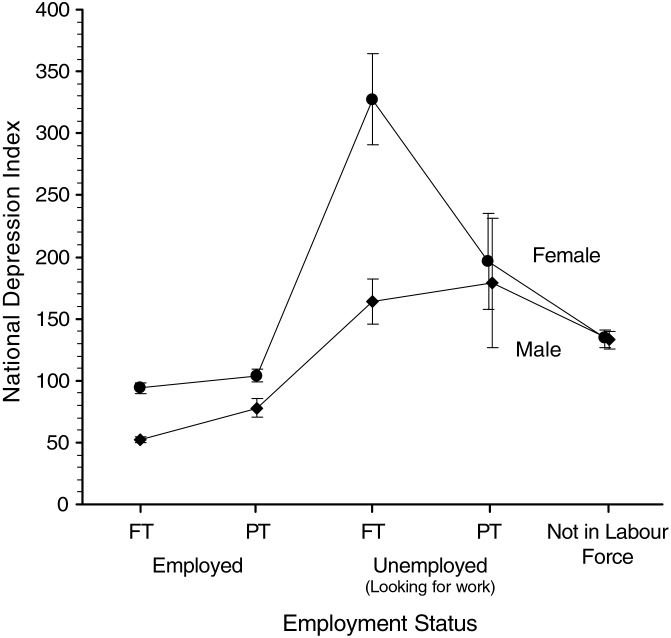
The graph on the left shows NDI for men and women grouped according to income. The NDI declines as income increases. For women the NDI is generally higher than for men in all but the lowest income groups. The graph on the right shows that people who are employed have a better (lower) NDI than the unemployed and those not in the labour force. These patterns correspond to the established epidemiology of depression: while they may not tell us much that is new about depression, they demonstrate that the NDI behaves as it should.
What the NDI is not for
The National Depression Index describes the status of the population or groups of people. It is not a method of diagnosing depression in an individual. It is certainly true that people with high values on the NDI items are likely to be depressed, but the information collected to calculate the NDI is not detailed enough to make an assessment of the status of someone who may be suffering from depression. For more information about depression and diagnosis, see the beyondblue web site.
Administering the K-10 items for the National Depression Index
The Kessler K-10 is a brief instrument and easy to administer. Full details of the US scale are available from its web site. It is important to note that the version of the K-10 used in both the National Survey of Health and Wellbeing and the ABS National Health Survey was adapted for local use and is not the same as the US version. The Australian version must be used if results comparable to the calibrated sample are to be produced. It is included in the downloadable file NDI.zip.
We hope that researchers will include it in projects so that the NDI will be available from many samples and in many situations. Although it is necessary to administer only six of the 10 items in the K-10 to calculate the NDI, we recommend including all 10 items whenever possible. It will then be possible to calculate values for the full scale and to compare these with other research using this scale.
Calculating the National Depression Index
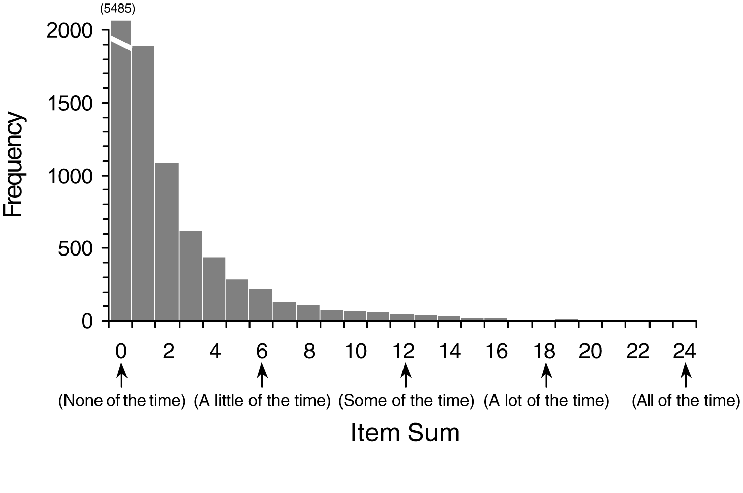
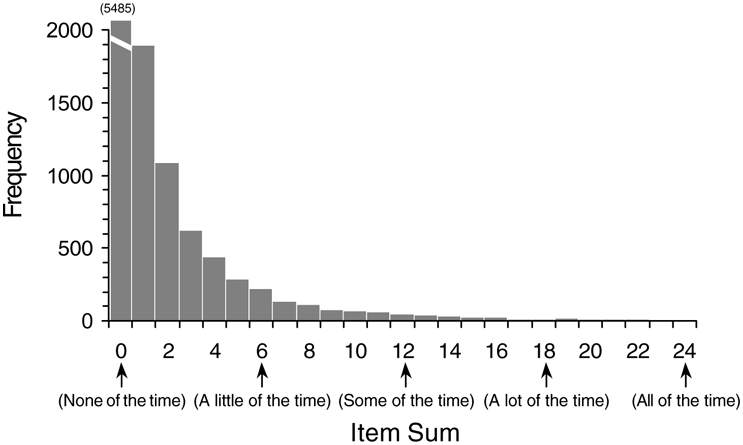
NDI scores are based on a transformation of factor scores calculated from the six K-10 items on which the index is based. Factor scores are used in preference to simply summing items. While the factor score and item sum are highly correlated, the former takes into account the discriminatory power of each item and its location on the underlying factor or dimension and is thus able to achieve finer degrees of discrimination between individuals (see graphs below).
|
|
|
|
Histogram of NDI Item Sum Scores |
Histogram of NDI Factor Scores |
A substantial problem with using factor scores is that special software is required to estimate them for each respondent. In the article, we used Mplus, a program designed to undertake factor analysis of ordinal data. As few potential users of the NDI will have access to this program, we have devised a method of obtaining factor scores and NDI values that is very simple and requires only the use of SPSS. Instructions, syntax and data files are contained in the file NDI.zip.
Once NDI values have been calculated for individuals in a group, the value of the Index for the group is simply the average of the individual values.
Statistical Issues concerning the NDI
Because individual NDI values were constructed to be interpretable as relative risk of depression compared to the Australian population, their distribution can be expected to be highly skewed in many groups: people who respond highly positively to multiple items on the K-10 are many, many times more likely than average to suffer from depression and thus their relative risk will be correspondingly high. When the NDI is calculated for a small sample, the presence of one or two frankly depressed individuals may dramatically influence the value of the index. Thus, care is required in interpreting index values in small samples. This is no different to the calculation of prevalence estimates in small samples. Because of the extreme values that may occur, individual index values are not recommended for use in statistical analyses. It would be reasonable and preferable to use the factor scores.
Go to top
Last updated January 2011.