by
Andrew Mackinnon
The text below is based on the manuscript that was ultimately published in Computers in Biology and Medicine. The citation is Mackinnon, A. (2000), A spreadsheet for the calculation of comprehensive statistics for the assessment of diagnostic tests and inter-rater agreement, Computers in Biology and Medicine, 30(3), 127-134. Reprints are available on request.
While advances in statistical methods allow greater insight into the characteristics of diagnostic tests and of raters, researchers frequently rely on incomplete or inappropriate indices of performance. Lack of available computer software is probably an important barrier to optimal use of data collected to evaluate diagnostic tests and agreement between raters. A spreadsheet has been designed to provide comprehensive statistics for the assessment of diagnostic tests and inter-rater reliability when these investigations yield data that can be summarized in a 2 x 2 table. As well as a wide range of indices of test or rater performance, confidence intervals for these quantities are also calculated by the spreadsheet.
Studies investigating the performance of diagnostic tests in medicine typically give rise to four-fold (2 x 2) tables crosstabulating the presence or absence of an illness or disorder against its putative presence or absence as indicated by the test under study. Cells in the table correspond to true positives, true negatives, false positives and false negatives.

In many applications such as the diagnosis of psychiatric illness, no objective method for establishing the presence of the disorder is available. In these circumstances agreement between two raters about the presence or absence of the disorder is the subject of evaluation.
Recent years have seen significant advances in the understanding of the appropriateness and limitations of indices used to assess performance in both these situations together with the development of alternative or additional coefficients that can reveal important characteristics of the test under investigation [1,2,3,4]. Advanced theoretical work has been complemented by didactic publications designed to inform researchers and clinicians working in specific branches of medicine about these issues. Unfortunately, these efforts have not been matched by the provision of comprehensive statistics for diagnostic tests and inter-rater agreement within widely used statistical packages. This may account for the many papers published in which diagnostic performance is incompletely assessed, with only basic indices reported, often unaccompanied by confidence intervals or standard errors.
The aim of the development of the DAG_Stat spreadsheet was to make available to researchers a comprehensive range of statistics for the assessment of the performance of diagnostic tests and inter-rater agreement. Implementation as a spreadsheet was chosen to ensure wide utilizability including cross-platform compatibility, transparency, and integration into the process of data processing and publication generation. Because formulae for all calculations are accessible, users may inspect, modify or adapt the spreadsheet to their own needs.
1.1 Assessment of the Performance of a Diagnostic Tests
Sensitivity (tp/p - the proportion of persons with the illness who are classified as 'ill' by the test) and specificity (tn/p' - the proportion of persons who do not have the illness who are classified as 'well' by the test) are the most widely used indices for the assessment of performance of a diagnostic test. It is not widely appreciated that the propensity of a diagnostic test to generate particular proportions of positive and negative results means that non-zero levels of sensitivity and specificity are to be expected even if the classifications made by the diagnostic test are independent of the disorder. If a test is operating at 'chance' levels of performance, it is easy to demonstrate that the expected sensitivity is equal to the proportion of observations classified as positive by the test. Similarly, the expected specificity is the proportion of observations classified as negative. Kraemer [1] has refined this notion, proposing two indices reflecting the 'quality' of sensitivity and specificity of the test. These indices adjust the raw sensitivity and specificity values for the values that would be expected to occur by chance alone. They may be seen as analogous to Cohen's kappa.
The conditional probabilities of observations that are positive and negative on the diagnostic test having or not having the disorder are referred to as the predictive values of positive and negative tests respectively. These probabilities are also of use in assessing the performance of a test. As with sensitivity and specificity, non-zero values of these indices are expected even if the test is operating at only chance levels. Under these conditions, the predictive values of the test will be determined by the prevalence of the disorder. It is possible to develop indices of the quality of the predictive values of the test. Given the interpretation of the quantities as conditional probabilities, this is perhaps less attractive than for sensitivity and specificity. In any case, quality indices for the predictive value of positive and negative tests can be shown to be identical to those for specificity and sensitivity respectively.
The likelihood or risk ratios of positive and negative tests, and the overall odds ratio of the test are also calculated. These quantities provide the same information as sensitivity and specificity or the predictive values of the test but do so in a different form. Some commonly used indices are of more questionable value, but are also reported, principally to allow comparison with published results.
Estimates of standard errors are available for most measures of test performance and enable the construction of confidence intervals. Many indices have a binomial distribution. It is common to use the normal approximation to the binomial in these cases. This approximation can be poor when the number of cases is small or when the index is close to 0 or 1 [5] . A number of methods of calculating confidence intervals that are more accurate than the normal approximation have been described. These include methods based on transformations [6] or use of bootstrapping techniques [7]. Another accurate method which uses the incomplete Beta function [8] is used by DAG_Stat to construct confidence intervals for proportions.
1.3 Assessment of the Inter-rater Agreement
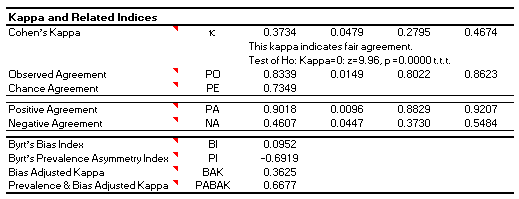
Cohen's kappa statistic is the most widely used coefficient describing the extent to which two raters agree about the presence or absence of a disorder. Much has been written about problems in using this coefficient as a measure of agreement and a number of alternative coefficients have been proposed. The approaches taken by Cicchetti and Feinstein [3] and by Byrt and his colleagues [4] can add substantially to understanding of the nature of agreement between the raters. DAG_stat implements both methods.
Cicchetti and Feinstein [2,3] argue that a single coefficient is necessarily an incomplete description of the relationship between the judgements made by the two raters. They proposed separate indices of positive and negative agreement and demonstrated that kappa is a weighted sum of these two quantities. In practical applications these supplementary indices can reveal, for example, that judges agree about the absence of a disorder, but not on its presence. This approach may be seen as analogous to the use of two indices in evaluating the performance of diagnostic tests. While the coefficients of positive and negative agreement can be shown to be identical to the index proposed by Dice in 1945 [9], no formula for its standard error could be found. Accordingly, the delta method [10] was used to develop an estimate of the standard error of each coefficient.
While fundamentally in concord with Feinstein and Cicchetti's [2,3] views about the causes of problems with kappa, Bryt and his colleagues [4] took a different approach to explicating the nature of agreement between raters: they derived two indices, one (the bias index) reflects differences in the rated prevalence of the disorder between the two judges; the other (the prevalence asymmetry index) reflects the predominance of cases of the disorder over non-cases. These indices are then used to adjust kappa, either for bias alone or for both bias and prevalence. The bias-adjusted coefficient can be shown to be identical to the coefficient of agreement proposed by Scott [4]. There has been comparatively little use of these coefficients. However, examination of the bias index would seem to have much to recommend it: lack of agreement between raters on the prevalence of a disorder is a fundamental failure in the judgement process. McNemar's test [10], also calculated by DAG_Stat, may be used to test the hypothesis that judged prevalence of the disorder differs significantly between raters.
The program also produces a number of other indices of agreement or concordance.
1.4 Other Statistics and Applications
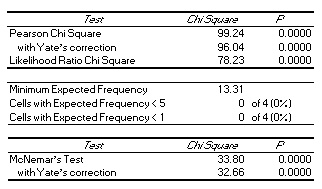
DAG_Stat reports both the Pearson chi-square (with and without Yate's correction) and the likelihood ratio chi-square test of association [10]. The number of cells in the table with expected values of less than 5 and less than 1 are reported. While DAG_Stat has been designed for assessing diagnostic tests and inter-rater reliability, it can, of course, be used to produce the above statistics for any 2 x 2 table and thus may be useful in other applications.
2.1 Diagnostic Test Statistics
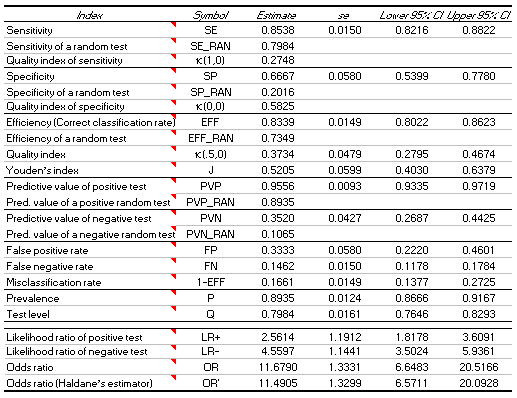
DAG_Stat calculates basic statistics regarding the test and diagnosis. These include the prevalence of the disorder and the test level (proportion of positive diagnoses), false positive, false negative, and overall misclassification rates.
For sensitivity, specificity and efficiency (the overall correct classification rate), the DAG_Stat calculates the value of the index, the value expected by chance alone and Kraemer's quality indices. Youden's index [11] is also output. The predictive value of a positive and of a negative test is calculated, as is the likelihood of each outcome and the overall odds ratio associated with the test.

The standard error of each statistic and its associated confidence interval is also calculated and displayed in a tabular format. In addition to the tabular display, a summary of each index and its confidence interval is provided in the form "Sensitivity = 0.85 (95% CI: 0.82 - 0.88)." Each of these summaries can be copied as a single cell and pasted as text in word processing programs to facilitate inclusion of results in research reports.
2.2 Inter-rater Agreement Statistics
DAG_Stat produces Cohen's kappa, its standard error, a standardized description of the strength of agreement [12] and a test of the hypothesis that kappa is non-zero. The uncorrected proportion of cases in agreement and the proportion expected by chance are also output. Two sets of supplementary statistics are calculated.

DAG_Stat produces a wide range of indices of association. A number of these have been used in studies of agreement or the performance of diagnostic tests.

The Pearson and likelihood ratio chi-square tests of association are calculated as in McNemar's test. The latter is particularly useful as a test of whether the proportion of positive cases is comparable between judges or between the criterion and the diagnostic test.

Data required by the spreadsheet are the cell counts for true positives, true negatives, false positives and false negatives. Values of the probability coverage for confidence intervals can also be specified by the user. It is possible to name the criterion and diagnostic test. The user may also specify the number of decimal places to be used in the one-line pastable summaries of each statistic. Macros are provided to toggle between decimal and percentage formats of appropriate indices, and to clear the table and update calculations. The latter functions are provided for use with slow machines. More details of how to use DAG_Stat can be found in the Introduction sheet in the spreadsheet itself and on the How to use DAG_Stat page.
The spreadsheet is implemented in Microsoft Excel, currently in version Excel 2003. Output from the spreadsheet under both early and later versions of Excel has been checked under a wide range of input values to ensure that accurate results are produced in all circumstances.
The performance of diagnostic tests is rarely explored fully by their developers. Similarly, researchers often fail to adequately investigate the nature of inter-rater agreement. While advances in statistical methods allow greater insight into the characteristics of tests and raters, researchers too rarely exploit these approaches. One possible reason for this is a lack of available computer software: detailed analysis of diagnostic tests and of inter-rater reliability is not a feature of widely used statistical packages. The DAG_Stat spreadsheet has been designed to provide comprehensive statistics for the assessment of diagnostic tests and inter-rater reliability when these investigations yield data that can be summarized in a 2 x 2 table. The implementation of the program as a spreadsheet means that it can be used on a wide range of computers and can be integrated into data analysis and report generation.